
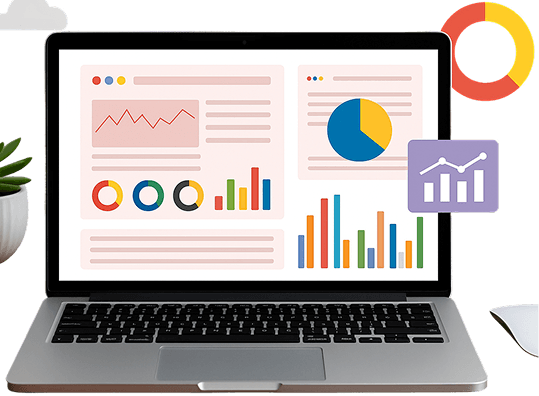
Dashboard & Analytics:
Master Textile Quality
with Data
QUONDA's quality analytics dashboard empowers you to manage POs, track sample sizes, and analyze audit outcomes. Track patterns, pinpoint issues, and make informed decisions, faster than ever.

Why Data Analytics Matters
Random Data = Missed Insights, Delayed Decisions, and Quality Inconsistencies.

In textile production, quality data is generated daily across purchase orders, samples, shipments, and audits. However, most of it exists in silos, on paper, across spreadsheets, or in disconnected systems. This makes it difficult to identify recurring defects (like specific defect types) or understand overall performance (on-time delivery vs. audit pass rates).

QUONDA’s inspection analytics brings clarity to your quality operations. It centralizes data from inspectors working in different locations. The real-time data helps to detect patterns early, optimize processes, and enable informed decisions.
How QUONDA’s Dashboard and Analytics Helps
What can I do with it?
Visualize and track inspections, audit results, and defect types. Gain detailed insights from data summaries to identify trends, bottlenecks, and uncover areas for improvement.
Who is this for?
Quality Managers, Production Supervisors, and Senior Management who need real-time QC analytics and insights. The purpose is to optimize textile quality, improve efficiency, and drive continuous improvement
When does this help?
Before, during, and after inspections. Whether preparing for a production run, monitoring audit results live, or reviewing performance over time. QUONDA keeps you informed at every step and helps in proactive decision-making.
Where does it work?
Across factories, vendors, and countries—whether inspections happen onsite or remotely. All analytics are centralized on QUONDA’s data dashboard for quality control, giving you a unified view across units, teams, and timelines.
Why should I care?
The QC data visualization enables smarter, faster decisions backed by data and not just guesswork. Improve product consistency, reduce manual reporting time, and get insights that reduce defects and improve first-time right rates.

How QUONDA’s Correction and Preventative
Action Plan Work
From Data to Decisions: Visualize Quality Metrics, Spot Trends, Boost Performance

Collect Data in Real Time
As inspections happen across production lines, QUONDA collects detailed quality metrics: defect types, counts, severities, timestamps, inspector input, and more, all in real time.

Sync and Centralize all Data
Whether on the shop floor or at remote facilities, all inspection data automatically syncs to QUONDA’s quality analytics dashboard, so no need for spreadsheets or scattered reports.

Visualize Trends and Metrics Instantly
The dashboard presents dynamic charts, summaries, and measurement breakdowns. Users can drill down by PO, date range, location, or defect category to uncover insights quickly.

View Detailed Analytics
Filter data with options that include date, defect type, inspector, or production line. Use the information to Identify trends, and recurring issues to improve workflow.

Generate Reports and Get Insights
QUONDA’s advanced dashboard allows brands to generate reports, export summaries, and share insights. Leverage inspection analytics with every stakeholder to make timely, data-backed decisions, optimize processes, and drive continuous improvements in textile quality
WHAT CLIENTS ARE SAYING...
I am glad to have QUONDA as an official apparel inspection software. It provides real time and seamless inspection planning, activities, results and analysis

Peter Fong
Quality Assurance Director, J.Crew

Don’t Just Collect Data, Understand It
Get QUONDA for Smart Decisions and Better Resolutions
Frequently Asked Questions
You can access detailed summaries and breakdowns for Purchase Orders, Sample Sizes, Shipped vs. Ontime Quantities, Audit Pass/Fail rates, and comprehensive insights into Defect Types and their breakdowns.
Yes, QUONDA allows you to filter data by date, location, product, or defect type. Brands can even configure dashboards to focus on the metrics most relevant to their team.
Data updates in real-time as inspections are logged or synced via the QUONDA mobile app or platform. This ensures you’re always working with the latest quality and production information.
No. QUONDA is designed for usability. The QC data visualization, trend lines, and defect reports can easily be understood by quality teams and managers.
It provides clear information and insights into quality issues. QUONDA helps you identify root causes, minimize rework, reduce waste, and optimize resource allocation. The result is significant cost savings in the long run.
Yes. QUONDA’s quality analytics dashboard is a cloud-based platform that allows you to access quality dashboards and analytics from any device, anytime, anywhere with an internet connection.
Turn Problems into Perfection.